
Loudness Range (LRA) is a single LU value that quantifies a programme's macro-dynamics: the difference between the 10th and 95th percentiles of its short-term loudness distribution. Set by EBU Tech 3342, it complements integrated LUFS rather than replacing it. A wide LRA means big dynamic swings between quiet and loud sections; a narrow one means a track sits at a fairly constant level. Broadcast guidance typically caps it at around 20 LU.
TL;DR:
- Fewer than ten gated short-term loudness measurements produce unreliable LRA percentiles, so avoid using LRA on very short programmes.
- LRA measures the spread of loudness over time using percentiles, not the absolute loudness or peak levels, and requires correct overlapping windowing and gating.
- For accurate results, always measure the full programme with tail silence, verify EBU compliance, and visually inspect the short-term loudness trace.
- LRA targets vary by genre, typically 3 to 6 LU for pop, 5 to 9 LU for rock, and above 10 LU for classical, depending on artistic intent and delivery context.
- Use LRA alongside integrated LUFS and true peak measurements to balance loudness, dynamics, and clarity rather than relying on a single number for mastering decisions.
Table of Contents
- Loudness range LRA explained: the algorithm and gating behind the number
- RMS vs LUFS vs LRA: how these metrics actually differ
- How to measure LRA accurately in your DAW
- LRA targets by genre and how they guide mastering decisions
- Where LRA readings mislead and how to catch it
- AubioMix benchmark data: what real LRA readings look like
- A mastering engineer's checklist for acting on LRA
- Get a genuine LRA reading with AubioMix
- Sources
Loudness range LRA explained: the algorithm and gating behind the number
Here's the thing about LRA that trips up a lot of engineers when they first meet it on a meter: it's not measuring loudness at all. It's measuring the spread of loudness over time. To get there, the algorithm has to build a whole distribution of loudness values first, then throw away the bits that would skew the picture.
It starts with short-term loudness. Your meter slices the programme into 3-second windows and calculates the loudness of each one using ITU-R BS.1770 as the underlying measurement standard, the same K-weighted, gated approach that gives you integrated LUFS. Those windows overlap by roughly 2.9 seconds, so a new short-term reading pops out roughly every 100 milliseconds, giving you a loudness trace sampled at close to 10 Hz. That overlap isn't arbitrary. Too little of it and you'd undersample fast-changing sections; mismatched overlap settings between meters are a genuine source of LRA discrepancies, which is worth remembering if two plugins ever disagree on the same file.
Once you have that dense trace of short-term values, gating kicks in. There's an absolute gate at −70 LUFS that strips out digital silence and near-silent passages, the kind of thing you'd get from a count-in or a long reverb tail. Then there's a relative gate at −20 LU below the (already absolute-gated) integrated loudness, which removes the quietest surviving material relative to the track's own overall level. What's left after both gates is the "gated distribution" the standard actually works with.
From that distribution, LRA is simply the 10th percentile subtracted from the 95th percentile. Not the loudest moment and the quietest moment. Percentiles. That distinction is the whole point: a single scream, a gunshot, or a long fade to silence would dominate a min/max measurement, but percentile-based gating quietly ignores them because they represent too small a fraction of the total programme. The EBU's own Tech 3342 documentation makes this explicit, and it's why LRA behaves so much more sensibly on real music and film mixes than a simple range calculation ever could.
| Stage | What happens | Threshold or window |
|---|---|---|
| Short-term windowing | Loudness calculated per window | 3 s window, ~2.9 s overlap |
| Absolute gating | Removes silence and near-silence | −70 LUFS |
| Relative gating | Removes quiet material vs. programme level | −20 LU relative |
| Percentile extraction | Defines the LRA figure itself | 95th percentile minus 10th percentile |
Practically, this means LRA needs a decent number of gated samples to mean anything. The standard itself notes that fewer than ten gated short-term measurements produce unstable percentiles, which is the root cause of the "don't trust LRA on short programmes" warning you'll see repeated everywhere. We'll come back to that.
RMS vs LUFS vs LRA: how these metrics actually differ
If you've only ever eyeballed an RMS meter, LRA can feel like a solution looking for a problem. It isn't. Each of these metrics answers a genuinely different question, and mixing them up is one of the most common ways engineers misread their own masters.
- Integrated LUFS tells you the overall perceived loudness of the whole programme, gated and K-weighted, and it's the number streaming platforms and broadcasters normalise to.
- LRA tells you how much that loudness moves around over the course of the programme. Two tracks can share an identical integrated LUFS figure and still feel completely different because one barely deviates from its average and the other swings wildly between verse and chorus.
- RMS measures raw signal energy over a chosen window, with no perceptual weighting and no gating, so it's a decent proxy for "how hot is this signal" but a poor one for "how loud does this sound".
- Crest factor (peak divided by RMS) tells you about transient headroom, useful for spotting over-compression, but it says nothing about how loudness evolves across a song's structure.
Picture two rock masters, both sitting at −9 LUFS integrated. Track A has been compressed hard across the board; verse and chorus barely differ, and its LRA comes out around 4 LU. Track B keeps a hushed, guitar-and-vocal verse and then opens right up for the chorus; same integrated LUFS, but an LRA closer to 9 or 10 LU. On paper they're equally loud. In the room, Track B breathes and Track A feels flat and one-dimensional, and that difference only shows up once you check LRA alongside LUFS.
The practical upshot for a working session: watch integrated LUFS and true peak when you're setting your delivery target, glance at short-term and momentary loudness while you're riding sections in real time, and check LRA once the mix is largely settled to confirm the dynamic arc actually matches what you intended. RMS and LUFS solve different problems, and treating them as interchangeable is how mixes end up either needlessly squashed or unpredictably dynamic on delivery.
How to measure LRA accurately in your DAW
Getting a trustworthy LRA reading isn't hard, but it does demand a bit more discipline than glancing at a peak meter. A few sloppy habits, an un-tailed export or a soloed section, and you'll get a number that has nothing to do with how the finished track will actually behave.
- Confirm your meter is EBU Mode compliant. Look for explicit documentation that it implements Tech 3342's gating and windowing, the same specification MathWorks' integratedLoudness function follows in its own implementation notes. Meters that only claim "LUFS support" without naming the algorithm can quietly diverge on edge cases.
- Render the full programme, never a soloed section. LRA needs the complete arrangement, intro through outro, to build a meaningful gated distribution.
- Add roughly 1.5 seconds of tail silence after the final note before you bounce, so decaying reverb or delay doesn't get clipped mid-measurement and skew the tail end of the loudness trace.
- Measure the whole render first, then re-measure section by section, verse, chorus, bridge, to see which part of the arrangement is actually driving the number.
- Watch the short-term loudness trace, not just the final LRA figure. A visual trace shows you exactly where loudness spikes or dips, which turns an abstract LU value into an actionable edit target.
- Test any edit by re-rendering and re-measuring, rather than assuming a change to one section moved LRA the way you expect.
Pro Tip: Keep a reference meter on hand, whether that's a dedicated hardware unit or a second plugin, and spot-check any track that gives you a surprising LRA reading. Small implementation differences between meters are well documented, and a five-minute cross-check saves you from chasing a number that was never wrong in the first place.
One more thing worth building into your workflow: don't solo the chorus to "check the loud part" and call that your LRA reading. That's a short-term loudness value for one window, not a programme-level LRA figure, and treating it as one is a mistake that even experienced engineers make when they're in a hurry.
LRA targets by genre and how they guide mastering decisions
There's no universal "correct" LRA, and treating any number as a hard rule is the fastest way to flatten a mix that didn't need flattening. What you're aiming for depends on where the track is going and what it's meant to feel like.
EBU R128 recommends LRA as a supplementary measure alongside programme loudness normalisation to −23 LUFS. Broadcast delivery specs commonly ask for LRA at or below 20 LU so that dialogue and mixed content stay intelligible across varied home-listening conditions. That figure is guidance for broadcast content, not a ceiling for every genre or platform.
Indicative ranges you'll typically encounter, purely as reference points rather than targets to hit on the nose:
- Pop and commercial hip-hop: often 3 to 6 LU, reflecting heavy compression and a fairly consistent energy level throughout.
- Rock: commonly 5 to 9 LU, with more room between verse restraint and chorus lift.
- Electronic and dance: frequently 3 to 7 LU, though builds and drops can push this higher on more arrangement-driven tracks.
- Classical and acoustic: often 10 LU and well beyond, since wide dynamic contrast is the entire artistic point.
- Film and television dialogue-driven content: usually kept tighter, closer to the broadcast guidance, so quiet lines don't disappear against ambient noise.
The real skill is balancing LUFS and LRA together rather than optimising either one in isolation. A mix can hit its loudness target and still feel wrong if compressing down to get there also crushes the LRA that gave the arrangement its shape. Reduce LRA deliberately when clarity is the priority, dialogue-heavy broadcast content, strict platform QC, background listening environments. Preserve it when the dynamic arc is the artistic statement, a string arrangement's crescendo, a slow-build electronic track, anything where "loud" and "quiet" sections are meant to feel genuinely different.
Where LRA readings mislead and how to catch it
LRA is a strong diagnostic tool, but it has real blind spots, and knowing them stops you from either dismissing a valid reading or trusting a bad one.
- Programmes under one minute produce unreliable percentiles. With too few gated short-term samples, the 10th/95th percentile calculation becomes statistically shaky, and Essentia's implementation notes explicitly advise against relying on LRA for very short content.
- Single loud events and long fade-outs get down-weighted by design. That's usually a feature, not a bug, but it means a jarring one-off transient won't necessarily show up in the LRA figure even if it's an audible problem worth fixing.
- Meters can disagree slightly even when both claim EBU Mode compliance. Windowing and overlap implementation details vary enough to shift a reading by a fraction of an LU.
- A "normal-looking" LRA can still hide a problem section. Always check the short-term trace visually rather than trusting the single summary number in isolation.
- Rerender with a controlled tail and no soloed sections whenever a reading looks suspicious, before you assume the meter or the mix is at fault.
AubioMix benchmark data: what real LRA readings look like
Numbers on a spec sheet only get you so far. What actually helps is seeing where real, released tracks land on the LRA scale, and that's the gap AubioMix's genre benchmark pages are built to close. Its pop mastering benchmarks and acoustic mastering benchmarks show measured loudness data across released tracks in each style, giving you an honest comparison point instead of a guess based on a handful of reference songs.
When you upload a mix to AubioMix, the analysis returns your LRA reading alongside integrated LUFS, true peak, and a visual short-term loudness trace, so you can see exactly which section of the arrangement is pulling that number up or down rather than staring at one static figure and guessing. That's paired with specific, actionable suggestions rather than a generic "reduce dynamics" note. A few examples of the kind of corrective step the report might surface:
- Tightening compression on a verse that's sitting well below the chorus, narrowing LRA without touching the chorus's punch.
- Automating a gain ride across a bridge section that the short-term trace shows dropping too far below the track's gated average.
- Flagging a fade-out that's contributing more to the tail of the distribution than expected, worth checking even though the percentile method generally down-weights it.
A sample report shows this laid out in full, which is worth a look if you want to see how the numbers and the recommendations sit side by side before you commit to a genre benchmark comparison of your own.
A mastering engineer's checklist for acting on LRA
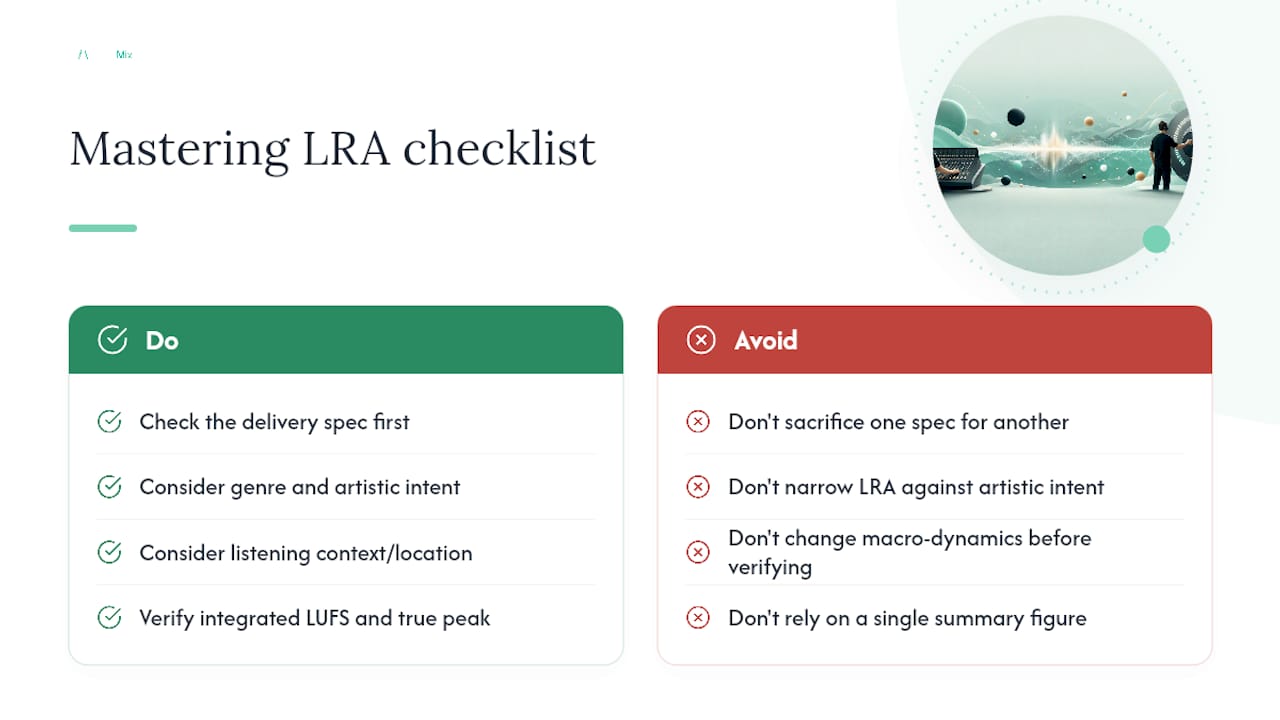
Before you touch a compressor because of an LRA reading, run through three questions. First: what does the delivery spec actually require? A streaming single and a broadcast package have different tolerances, and you shouldn't sacrifice one for a target the other never asked for. Second: does the genre or the artistic intent call for width here, or consistency? A ballad that swells from whisper to full band is supposed to have a wide LRA; narrowing it kills the arrangement's whole reason for existing. Third: where will this actually get heard? Car stereos and noisy commutes reward a tighter LRA; a critical-listening context can support far more spread.
Before changing any macro-dynamics based on an LRA number, verify integrated LUFS and true peak first. Those two numbers set your ceiling and your target; LRA should inform how you get there, not compete with them for priority. Build a check of the short-term loudness trace into your final QC pass alongside the more familiar peak and loudness readings; it takes thirty seconds and it catches problems a single summary figure never will.
— AubioMix
Get a genuine LRA reading with AubioMix
Reading your own meter is one thing. Knowing whether your LRA figure sits where it should for your genre, and what to actually do about it if it doesn't, is a different problem entirely, and it's the one AubioMix was built to solve. Upload a mix and you get an automated LRA measurement, a visual short-term loudness trace, and a direct comparison against genre benchmarks, paired with specific corrective steps rather than a single unexplained number.
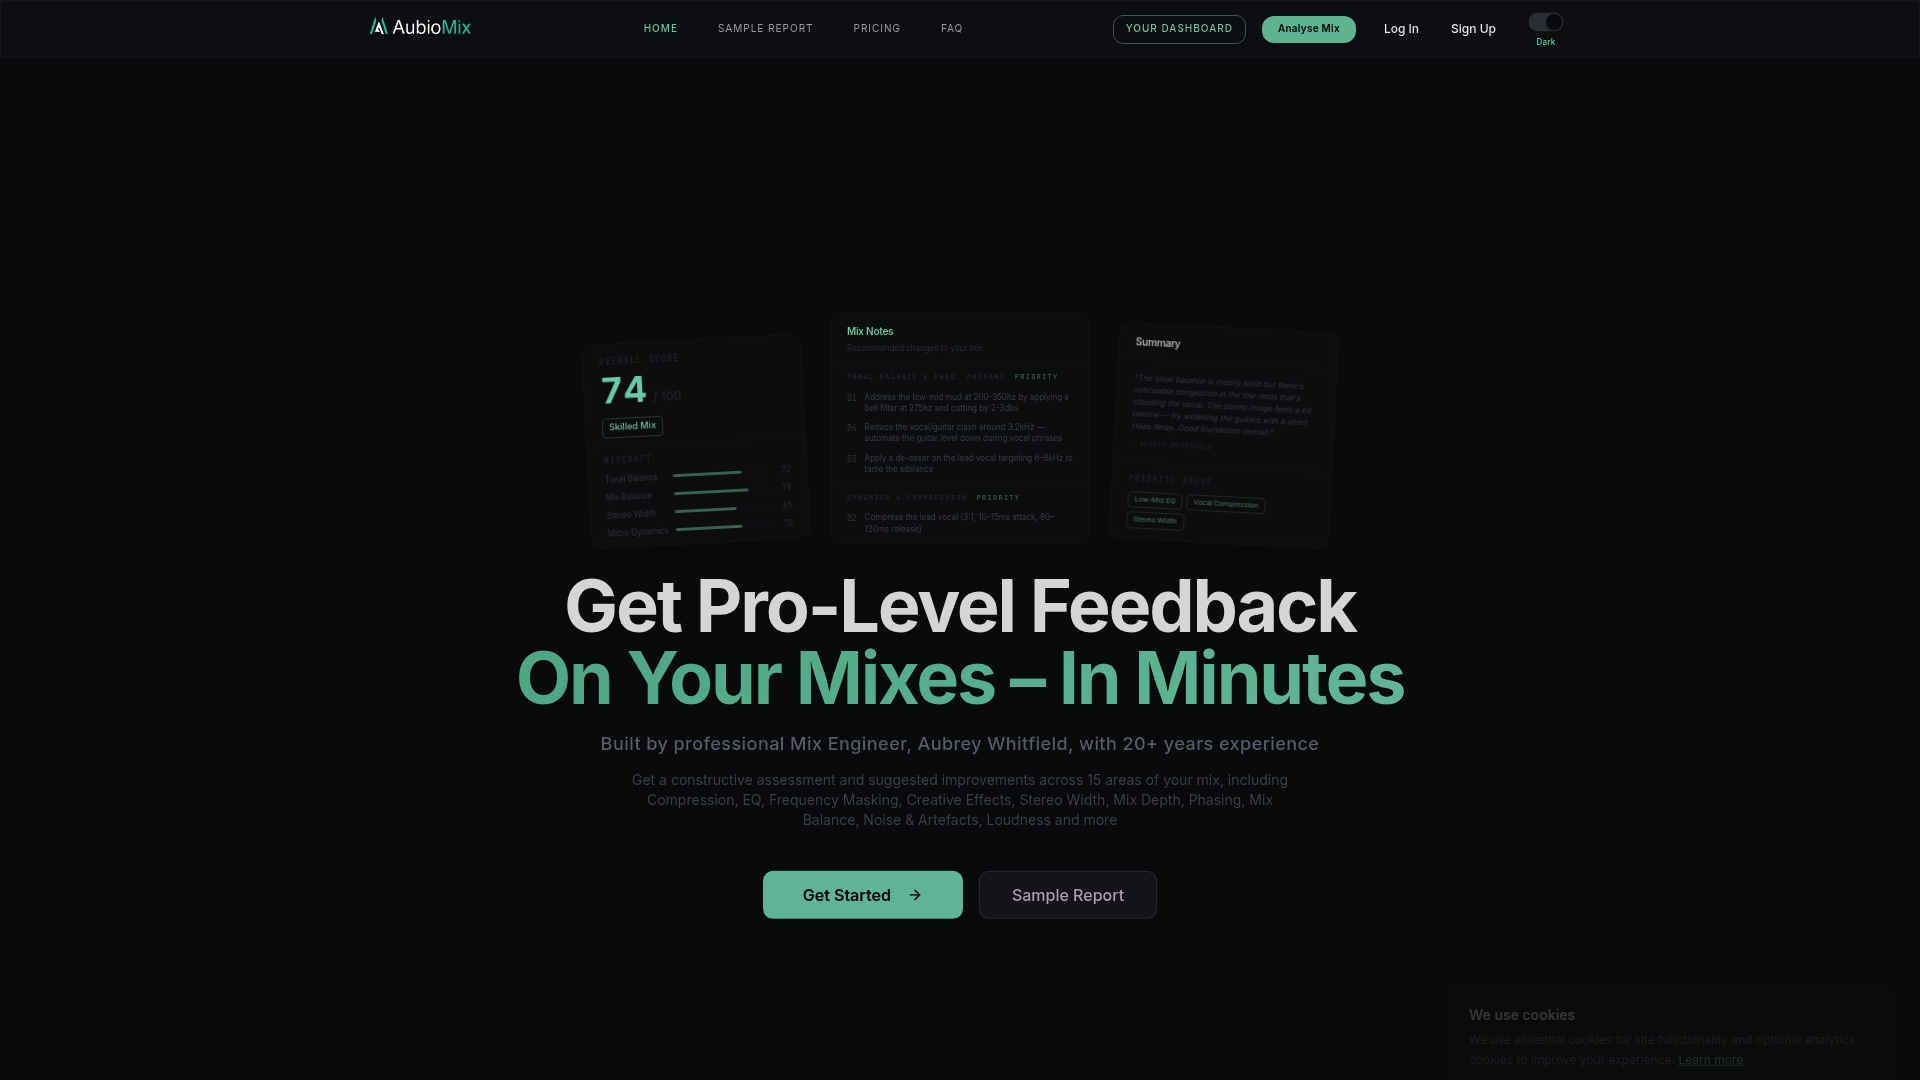
You don't need to guess whether your LRA reading is a problem or exactly what the arrangement calls for. Check the evaluation framework to see how the analysis breaks down loudness alongside the other 15-plus areas AubioMix reviews, or browse a sample report to see LRA presented next to LUFS, true peak, and the recommendations that follow from them. Upload your next master and see where it actually lands.
Sources
For anyone who wants to go straight to the source rather than take a meter's word for it, EBU Tech 3342 is the specification that defines the LRA algorithm itself, gating thresholds and all. EBU R128 supplies the broadcast normalisation context LRA was designed to support. ITU-R BS.1770 underpins the K-weighted loudness measurement both standards build on, and MathWorks' own implementation notes for integratedLoudness show how the algorithm behaves in practice. Essentia's EBU R128 reference documentation and the design and evaluation paper on LRA round out the technical picture with implementation caveats and test-signal validation.
- Loudness range: A measure to supplement EBU R 128 loudness normalisation
- Loudness (EBU R128) reference — Essentia
- integratedLoudness — MATLAB documentation