

A spectrum analyser is a visual confirmation tool that helps you catch frequency problems your ears might miss, and every producer should know how to use one. Insert Voxengo SPAN on your master bus right now and try these three things:
- Check for subsonic rumble below 30 Hz. If you see energy down there, a high-pass filter will clean it up without touching anything musical.
- Load a reference track into your DAW and compare its spectral shape to yours. Notice where your mix is heavier or thinner.
- Solo your kick and bass together and look for overlapping peaks in the 60–100 Hz region. That overlap is frequency masking, and it is often the reason your low end sounds muddy rather than punchy.
SPAN is a great first analyser because it is free, offers adjustable FFT size and averaging, and even includes a correlation meter for mono compatibility checks.
Key takeaways
A spectrum analyser is most valuable as a confirmation tool: use it to verify what your ears suspect, not to make creative decisions for you.
| Point | Details |
|---|---|
| Ears lead, analyser confirms | Open the analyser only when a persistent problem resists your ears, not as a constant overlay. |
| Match levels before comparing | Always level-match your mix to a reference before reading the spectral shape; louder always looks fuller. |
| Match FFT size to the task | Use a high FFT (8192+) for resonance hunting and a lower FFT (4096) for overall tonal balance checks. |
| Check mono on the master | Flip to mono and watch the spectrum collapse; disappearing frequencies signal phase problems worth investigating. |
| Cut 150–500 Hz for boxiness | Judicious cuts in this range reduce muddiness; a gentle broad boost near 12 kHz can restore clarity and air. |
Table of Contents
- What does a spectrum analyser actually show you?
- The concrete benefits of using a spectrum analyser when mixing
- When and where in your workflow should you use an analyser?
- How to set up your analyser: FFT size, averaging and display scale
- Step-by-step micro-recipes for fixing real mix problems
- Common mistakes that trip up producers using spectrum analysis
- Which spectrum analyser plugins should you use?
- How automated mix analysis complements your analyser
- Aubiomix's perspective: when to reach for the analyser
- Sources
What does a spectrum analyser actually show you?
At its core, a spectrum analyser measures amplitude versus frequency, displaying the result as a continuous curve. Frequency runs left to right (low frequencies on the left, highs on the right), and amplitude runs vertically in decibels (dB). That much is straightforward. The controls underneath the display are where things get interesting.
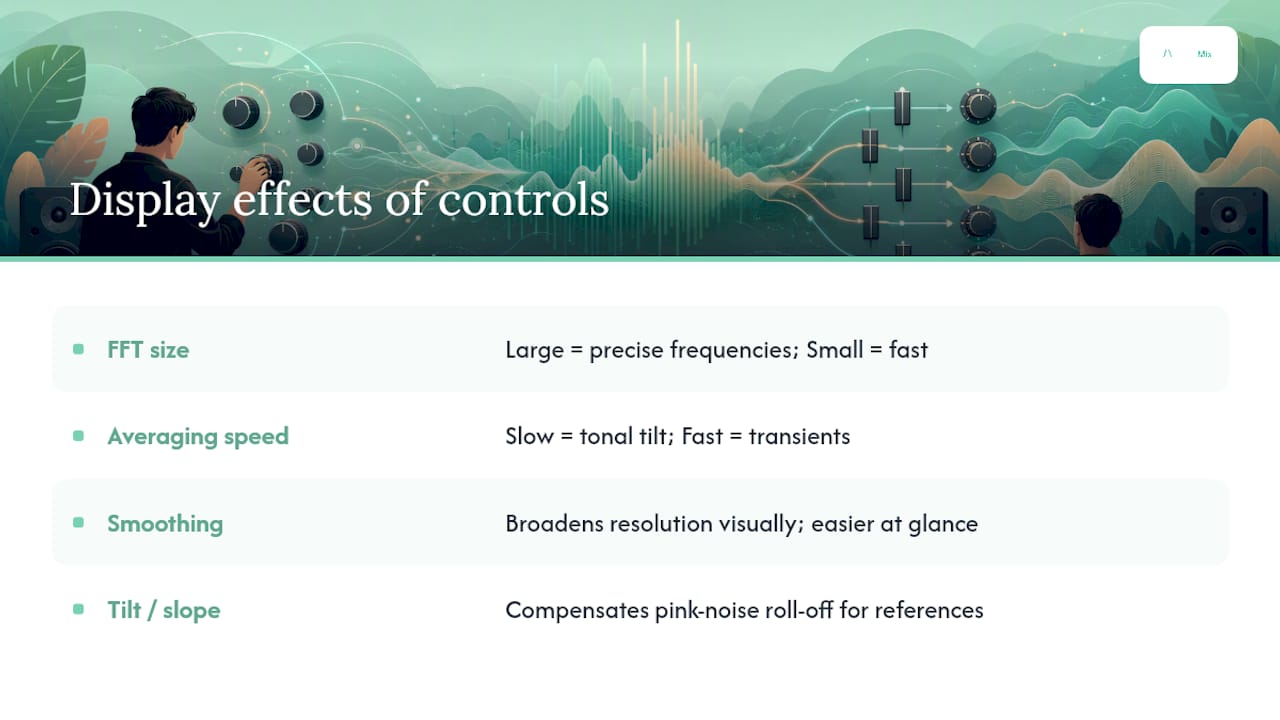
FFT size (Fast Fourier Transform window size) determines frequency resolution. A large FFT window resolves individual frequencies precisely but updates slowly. A small window updates fast but blurs neighbouring frequencies together. Averaging smooths the trace over time, so a slow average shows you the overall tonal tilt of a mix, while a fast response lets you watch transients move in real time. Smoothing broadens the frequency resolution visually, making the curve easier to read at a glance. A tilt/slope setting compensates for the natural roll-off of pink noise, letting you compare your mix against a reference without the high end looking artificially thin.
What the analyser cannot show you is equally worth knowing. It has no opinion on whether a sound is musical, emotionally engaging, or appropriate for the genre. A perfectly flat spectrum can sound lifeless; a lopsided one can sound brilliant. The graph reveals spectral content, not quality.
The concrete benefits of using a spectrum analyser when mixing
Used correctly, a spectrum analyser identifies subsonic rumble and persistent resonances that ears alone often miss, especially after a long session. Here is what it practically delivers:
- Find resonances fast. A narrow spike at, say, 220 Hz on a guitar bus is almost impossible to hear in isolation but jumps out visually. You can sweep a narrow EQ band to confirm it aurally, then notch it out.
- Spot low-end conflicts. Place an instance on your kick and another on your bass. If both show a broad peak centred around 80 Hz, they are competing for the same space. A quick sidechain or frequency carve, confirmed visually, fixes the clash.
- Guide EQ decisions. Seeing a broad hump in the 200–400 Hz range on your mix bus gives you a starting point. You still listen to confirm, but the analyser narrows the search considerably.
- Check translation. Compare your mix's spectral shape to a reference track at the same perceived loudness. If your mix looks dramatically darker or brighter, it may not translate well on different playback systems.
The golden rule, though: ears lead, the analyser confirms. Successful engineers reach for the analyser when a persistent problem resists their ears, not as a constant overlay on every channel.
When and where in your workflow should you use an analyser?
The insert point determines what question you are answering.
On a single track, the analyser shows you the raw spectral character of that source. It is the right place to hunt resonances or check whether a vocal has excessive sibilance before it reaches the bus.
On a group bus, you see how instruments in that group interact. The kick and bass bus is the classic example: you can watch their combined low-end energy and spot masking that would not be obvious on either track alone.
On the master bus, the analyser gives you the overall tonal balance of the mix. This is where reference matching happens. For a fuller picture of how each stage connects, the mix engineer workflow guide covers the full session arc.
Two moments in a session particularly benefit from pulling up the analyser. First, during initial cleanup, before you start creative EQ moves. Second, when ear fatigue sets in after a long session. An analyser provides an objective second opinion in untreated rooms, revealing room-driven peaks and dips that your monitors or headphones may be hiding from you.
One more habit worth building: flip your master bus to mono and watch the spectrum. Frequencies that collapse or disappear in mono signal phase problems. A correlation meter alongside the analyser confirms this numerically.
How to set up your analyser: FFT size, averaging and display scale
FFT resolution is a trade-off: higher FFT sizes give finer low-end detail for hunting resonances but update more slowly, while lower sizes respond faster for watching overall balance. Here are practical starting points:
For display scale, set your dB range to show roughly 60–80 dB of dynamic range. Wider than that and small problems disappear; narrower and everything looks dramatic. Apply a pink-noise tilt (around 3–4.5 dB per octave) when comparing to references so the high-frequency roll-off does not mislead you.
Common EQ targets supported by Sound On Sound guidance include cutting between 150–500 Hz to reduce boxiness and applying a gentle broad boost near 12 kHz, combined with subtle cuts in the 150–300 Hz region, to restore clarity and air.
Pro Tip: *Save two SPAN presets: one called "Balance" (slow average, 4096 FFT, pink tilt on) and one called "Hunt" (fast response, 16384 FFT, no smoothing).
Step-by-step micro-recipes for fixing real mix problems
Remove subsonic rumble
- Insert an analyser on the track (or bus) in question.
- Look for energy below 30 Hz. If it is there, it is almost certainly inaudible but wastes headroom.
- Apply a high-pass filter at 20–30 Hz, then level-match the output and re-check the spectrum to confirm the energy is gone without affecting the fundamental.
Locate and notch a resonant peak
- Switch to your "Hunt" preset (high FFT, fast response).
- Play the problematic section on loop and watch for a narrow spike that stays consistent.
- Add a narrow EQ band (Q around 8–10), boost it sharply, and sweep until the resonance becomes painfully obvious aurally.
- Flip to a cut, reduce gain to taste, and confirm the spike has dropped on the analyser.
Fix kick and bass masking
Place an analyser instance on each track and play both together. If both show a broad peak in the same 60–100 Hz band, you have masking. Decide which element owns that frequency range (usually the kick's transient or the bass's fundamental), then carve space for the other with a gentle cut. Solo and mute alternately to confirm the separation aurally before trusting the visual result.
Pro Tip: Always level-match before comparing your mix to a reference. A louder signal always looks fuller on the analyser. Use your analyser's gain trim or a reference plugin to match perceived loudness first, then compare shapes.
For deeper reading on frequency masking strategies, the Aubiomix guide covers carving techniques in detail.
Common mistakes that trip up producers using spectrum analysis
The biggest trap is letting the graph make decisions. Here are the pitfalls to watch for:
- Chasing a flat line. No genre sounds flat. A well-mixed pop track has a gentle downward tilt from low to high. Forcing flatness produces a thin, unpleasant result.
- Over-EQing every peak. Not every bump is a problem. Some peaks are the character of the instrument. Listen first; only reach for EQ if the peak causes an audible issue.
- Ignoring level-matching. Comparing your mix to a reference at different loudness levels is meaningless. The louder signal always looks more impressive.
- Trusting the analyser in an untreated room. Room modes create peaks and dips in your monitoring that appear on the analyser but do not exist in the mix. Cross-reference with headphones.
A short checklist to keep you honest: listen first → identify the problem aurally → open the analyser to confirm → fix conservatively → re-listen away from the screen. The signs your mix needs work guide pairs well here for a broader diagnostic sweep.
The analyser also cannot judge musicality, emotional impact, or whether a mix suits its genre. Those decisions belong entirely to your ears.
Which spectrum analyser plugins should you use?
- Voxengo SPAN (free, Windows/Mac): adjustable FFT size, averaging, correlation metering and presets. The best first analyser to learn on, and genuinely useful at every level.
- iZotope Insight (paid): a full metering suite covering LUFS, true peak, loudness history and a spectrum display. Ideal when you need integrated loudness metering alongside spectral analysis.
- iZotope Tonal Balance Control: overlays your mix's spectral shape against genre-specific reference targets. Particularly useful for checking whether your overall tonal tilt matches the genre you are working in.
SPAN has no meaningful CPU cost and zero latency in analysis mode. Insight and Tonal Balance Control carry a small CPU overhead but nothing that should concern a modern machine.
How automated mix analysis complements your analyser
A real-time spectrum analyser answers questions in the moment. Automated mix analysis answers a different set of questions: how does this mix perform across consistent metrics, and where does it sit relative to other productions?
Services like Aubiomix generate structured feedback across areas including spectral imbalance, LUFS, true peak, phase coherence, and frequency masking, producing a written report with specific steps rather than a live graph. The practical split looks like this:
- Use your real-time analyser to confirm a suspicion, hunt a resonance, or check mono compatibility during the session.
- Use automated analysis to catch persistent translation problems, benchmark loudness, and get a consistent cross-project view of where your mixes stand.
Neither replaces the other. The analyser is fast and local; the report is thorough and comparative. Together they cover ground that neither covers alone.
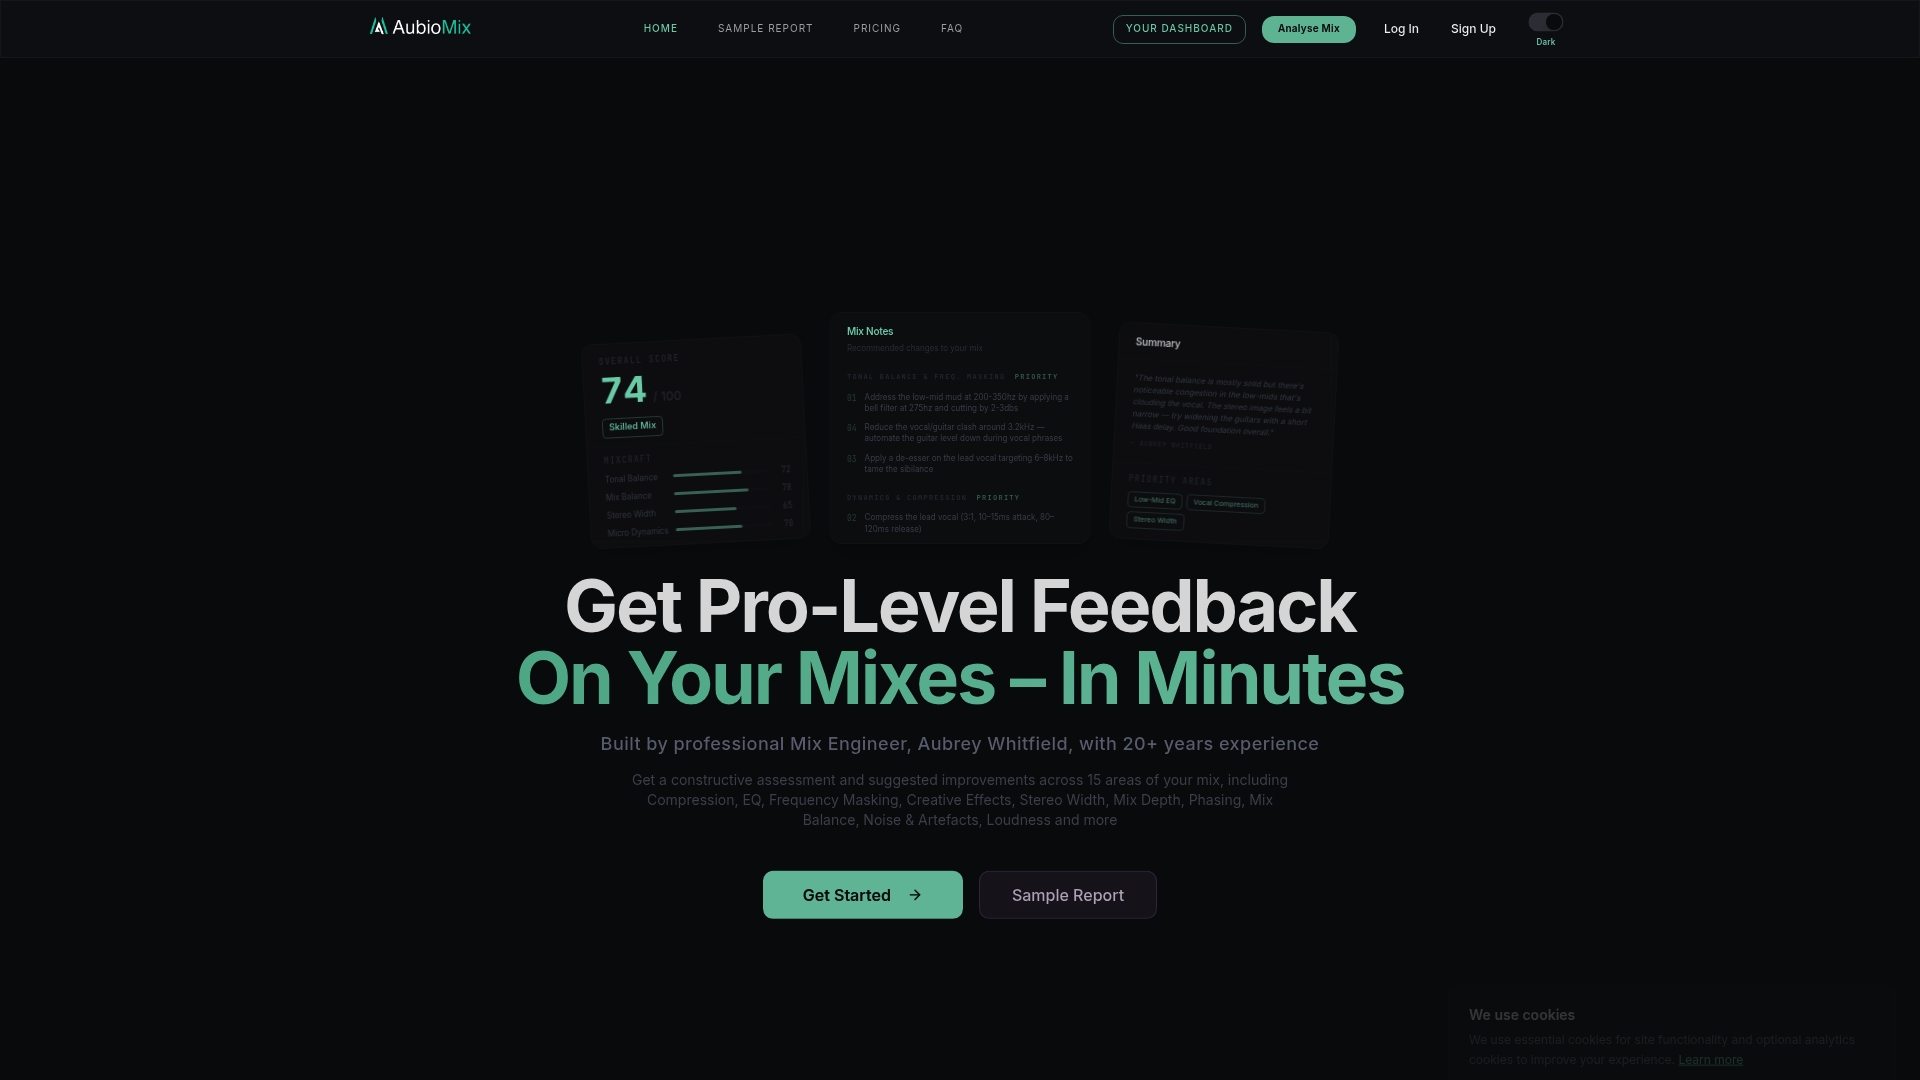
Ready to see exactly where your mix stands? Upload your track to Aubiomix and get detailed feedback across 15+ mixing and mastering areas in minutes, including spectral balance, LUFS, true peak, and phase notes, with a downloadable PDF report and progress tracking built in.
Aubiomix's perspective: when to reach for the analyser
The ear-first rule is not a polite suggestion. It is the difference between a mix that sounds right and one that merely looks right on a graph. Two moments consistently justify opening the analyser mid-session: after tracking a bass-heavy element, to confirm there is no subsonic content eating headroom before the arrangement builds further; and after an extended session, when ear fatigue makes high-frequency judgements unreliable and you need an objective read on whether the mix has drifted dull or harsh.
What often gets overlooked is the slow-average setting. Most producers open an analyser and leave it on a fast response, which makes the display jitter constantly and trains the eye to chase every transient. Switch to a slow average of two to four seconds when you want to judge overall tonal balance. The curve settles, and you can actually read it. Switch back to fast response only when you are hunting a specific resonance. That single habit change makes the tool dramatically more useful.
Sources
These sources are worth bookmarking for deeper technical detail:
- How to Use a Spectrum Analyzer (Without Mixing by Eye)
- How to Use a Spectrum Analyzer in Music Production, Mixing & Mastering
- How to mix music: the essential guide for beginners
A final reminder: always level-match before any visual comparison. The louder signal will always look more impressive on the spectrum, and that impression is not a mix decision.