

Crest factor is defined as the ratio of an audio signal's peak amplitude to its RMS (root mean square) level, and it tells you exactly how "spiky" or dynamic a waveform is. A pure sine wave sits at roughly 3 dB, meaning its peaks are only slightly higher than its average energy. A drum hit or sharp transient can push well beyond 20 dB, with peaks towering far above the average. That gap between peak and average is the whole story of dynamic range, and understanding it is what separates a flat, lifeless mix from one that breathes and hits hard. Standards like EBU R128 and ITU BS.1770 are built around this relationship, which is why every serious mixing and mastering decision traces back to it.
How is crest factor measured and calculated?
Crest factor calculation is straightforward: divide the peak amplitude by the RMS value. In decibels, that means subtracting the RMS level from the peak level. A signal peaking at 0 dBFS with an RMS of minus 10 dBFS has a crest factor of 10 dB.

Typical waveform crest factors vary significantly by shape:
| Waveform | Crest factor (ratio) | Crest factor (dB) |
|---|---|---|
| Sine wave | 1.414 | ~3 dB |
| Square wave | 1.0 | 0 dB |
| Triangle wave | 1.732 | ~4.8 dB |
| Drum transient hit | 10+ | 20 dB+ |
The square wave's crest factor of 0 dB tells you its peaks and average are identical. That is the sonic equivalent of a wall of sound with no dynamic movement. A drum transient at 20 dB+ is the opposite: enormous peaks relative to a low average, which is why drums feel punchy even at moderate loudness.
DAW plugins measure crest factor by displaying simultaneous peak and RMS readings, often alongside loudness meters conforming to EBU R128 and ITU BS.1770. Some simpler interfaces label the result as "dynamic range" rather than crest factor, which is functionally the same thing in this context.
Key things to keep clear when measuring:
- Peak level is the highest instantaneous sample value in the signal.
- RMS level is the average energy over a defined time window.
- Crest factor is the relationship between the two, not a standalone absolute value.
Pro Tip: Set your DAW's RMS window to around 300–400 milliseconds for a reading that reflects perceived loudness rather than momentary spikes. This gives you a crest factor figure that actually maps to how the mix feels to a listener.
Why does crest factor matter for mixing and mastering?
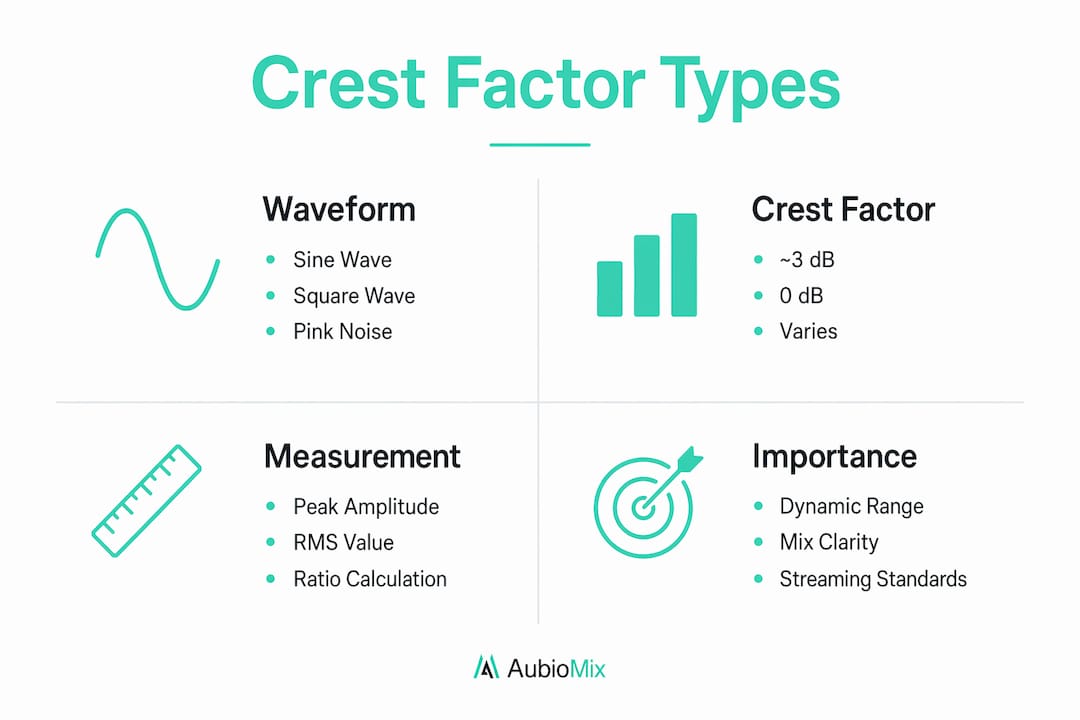
Mix engineers use crest factor to assess the dynamic character of a signal. A lower crest factor signals heavy compression. A higher crest factor means preserved transients and punch. This single metric tells you more about a mix's energy than a peak meter ever could.
Here is why it matters in practice:
- Perceived loudness: A high crest factor signal sounds quieter than a compressed signal at the same peak level, because its average energy is lower. Streaming platforms normalise to a target loudness (typically minus 14 LUFS on Spotify), so a mix with preserved dynamics will not be penalised for having headroom.
- Headroom management: High crest factor signals need more headroom to avoid clipping. A drum bus with 20 dB of crest factor requires careful gain staging throughout the signal chain.
- Distortion and clipping: When peaks exceed 0 dBFS, you get digital clipping. Understanding crest factor tells you how much room you have before that happens.
- Mix clarity: Transients carry the attack and definition of instruments. Crushing them reduces crest factor and muddies the mix.
"Crest factor quantifies how much 'life' and impact remains in a mix. A mix with healthy crest factor retains punch and clarity. One with zero crest factor is technically loud but sonically dead."
The loudness war of the 2000s was essentially a race to reduce crest factor to zero. Streaming normalisation has made that approach counterproductive. A mix with a crest factor of 12–14 dB on the master bus is well positioned for both loudness and dynamics on modern platforms.
Pro Tip: Check your master bus crest factor before and after your limiter. If the limiter is reducing it by more than 4–6 dB, you are likely losing more punch than you are gaining in loudness. Back off the ceiling and let the transients breathe.
What techniques help producers control crest factor?
Managing crest factor is about knowing when to preserve peaks and when to tame them. Here are the main tools and how they affect the ratio.
-
Transient shaping. Transient shaping increases crest factor by enhancing the attack phase of a sound relative to its sustain. On a snare drum, boosting the transient makes the crack sharper without raising the overall RMS. The result is more punch at the same average loudness.
-
Compression. Compression reduces crest factor by raising the average level relative to the peaks. A fast attack compressor on a drum bus will clamp down on transients, narrowing the gap between peak and RMS. Used carefully, this adds density. Used aggressively, it kills the life of the mix.
-
Limiting. A peak limiter sets a hard ceiling on peak levels. This reduces crest factor at the top end. The key is to limit gently, typically no more than 1–3 dB of gain reduction on a master limiter, so the transients remain largely intact.
-
Back-off strategies. Telecommunications engineers manage high crest factor signals by reducing amplifier output levels, a technique called "back-off." Audio mastering borrows this directly: when a signal has a high crest factor, lowering the master ceiling preserves transient integrity rather than clipping peaks. Trading a fraction of peak volume for transient clarity is nearly always the right call.
-
Saturation. Subtle analogue saturation rounds off peaks gently, reducing crest factor slightly while adding harmonic warmth. It is a softer alternative to limiting and works particularly well on bus processing.
For a full breakdown of how these tools fit into a professional signal chain, the guide on mixing chain best practices covers gain staging and dynamic processing in depth.
Pro Tip: Use a transient shaper before your compressor on drum buses. Shaping the attack first means the compressor responds to a more consistent signal, giving you better control over the final crest factor without over-compressing.
How does crest factor relate to peak-to-average power ratio (PAPR)?
Crest factor and peak-to-average power ratio (PAPR) describe the same phenomenon from different angles. Crest factor is a voltage measurement. PAPR is a power measurement. The mathematical relationship between the two is that PAPR in dB equals the square of the crest factor expressed as a ratio, or equivalently, twice the crest factor in dB.
A voltage crest factor of 3.16 (10 dB) corresponds to a PAPR of 10 dB in power terms. This matters because audio equipment specifications sometimes reference power rather than voltage, and confusing the two leads to incorrect headroom calculations.
Here is how the two metrics compare for common waveforms:
| Waveform | Voltage crest factor (dB) | Power PAPR (dB) |
|---|---|---|
| Sine wave | ~3 dB | ~3 dB |
| Square wave | 0 dB | 0 dB |
| Triangle wave | ~4.8 dB | ~4.8 dB |
| Drum transient | 20 dB+ | 20 dB+ |
For audio signals, the distinction between voltage crest factor and power PAPR is most relevant when working with amplifiers, converters, and broadcast equipment. In a typical DAW environment, crest factor as a voltage ratio is the standard reference.
Key points to keep in mind:
- Both metrics increase with transient content and decrease with compression.
- Crest factor reduction techniques from telecommunications, such as clipping and filtering, have direct parallels in audio mastering.
- Understanding PAPR helps when reading equipment specifications for amplifiers and digital converters, where power headroom is the relevant figure.
How to use crest factor trends for mix diagnostics
Static peak and RMS readings give you a snapshot. Crest factor trending over time reveals the dynamic behaviour of a mix across its full duration, and that is where the real diagnostic value lives.
Watching crest factor change section by section tells you things a single reading never could. A chorus that drops in crest factor compared to the verse suggests the compression is working harder there, which may or may not be intentional. A bridge with a sudden spike in crest factor might indicate an uncontrolled transient that will cause issues in mastering.
Practical ways to use crest factor trends in your workflow:
- Section-by-section comparison. Render stems or sections and compare their crest factors. A consistent drop across the chorus is fine if it is deliberate. An inconsistent pattern points to uneven processing.
- Spotting over-compression. If crest factor drops below 6 dB on the master bus during loud sections, your limiter or bus compressor is likely working too hard.
- Identifying rogue transients. A sudden spike in crest factor often points to a single instrument with an uncontrolled attack. Isolate it and apply targeted transient shaping rather than blanket compression.
- Tracking dynamics across the mix. Use a loudness meter with a crest factor or dynamic range display and watch it in real time during playback. The number should move. A static reading means the mix has no dynamic variation.
Tracking crest factor trends reveals transient behaviour that static peak readings miss entirely. This is the difference between reacting to a problem after mastering and catching it during the mix.
Pro Tip: Export a rough master and run it through a dynamic range meter before sending it to a mastering engineer. A DR reading below 8 on a full mix is a warning sign that the dynamics have been over-processed. Aim for DR 10 or above on most genres.
For more on preparing a mix for mastering with dynamic range in mind, including gain staging and headroom targets, that guide covers the full pre-mastering checklist.
Key takeaways
Crest factor is the single most useful metric for diagnosing dynamic range problems in a mix, because it captures the relationship between transient peaks and average energy in one number.
| Point | Details |
|---|---|
| Core definition | Crest factor is peak amplitude divided by RMS level, expressed in dB or as a ratio. |
| Waveform reference | Sine waves sit at ~3 dB; drum transients regularly exceed 20 dB. |
| Compression effect | Heavy compression reduces crest factor, raising average energy but flattening transient punch. |
| Mastering application | Back-off strategies preserve transient integrity by lowering the limiter ceiling rather than clipping peaks. |
| Diagnostic use | Trending crest factor across mix sections reveals over-compression and rogue transients that static meters miss. |
The loudness war is over. Crest factor won.
I have spent a long time watching producers chase loudness by squashing crest factor to near zero, and the results are almost always the same: a mix that sounds impressive for ten seconds and exhausting for ten minutes. Extreme compression aimed at zero crest factor causes ear fatigue and strips away the micro-transients that make a mix feel alive. That is not a technical opinion. It is something you hear immediately when you A/B a well-preserved mix against an over-limited one.
The misconception I see most often is that a higher RMS level equals a better mix. It does not. A mix with a healthy crest factor of 10–14 dB on the master bus will translate better across streaming platforms, sound systems, and headphones than one that has been brickwalled into submission. Streaming normalisation has levelled the playing field. The mixes that stand out now are the ones with dynamics, not the loudest ones.
My honest recommendation: treat crest factor as a creative tool, not just a technical constraint. Use it to make deliberate decisions about where your mix should feel dense and where it should breathe. A compressed verse leading into a chorus with preserved transients creates genuine contrast. That contrast is what listeners feel, even if they cannot name it.
— Aubiomix
How Aubiomix analyses your mix dynamics
Getting objective feedback on your mix's dynamic range used to mean hiring a mastering engineer or spending hours with metering plugins. Aubiomix changes that.

Upload your track to Aubiomix and receive detailed feedback on your mix's dynamic characteristics, including crest factor analysis, RMS levels, peak readings, and loudness targets aligned with EBU R128 standards. The platform identifies where your dynamics are working well and where over-compression or uncontrolled transients are causing problems, then gives you specific, actionable steps to address them. Whether you are preparing a mix for mastering or trying to understand why your track sounds flat compared to a reference, Aubiomix gives you the clarity to fix it fast.
FAQ
What is crest factor in audio?
Crest factor is the ratio of a signal's peak amplitude to its RMS level, expressed in dB or as a plain ratio. It measures how dynamic or "spiky" a waveform is.
How do I calculate crest factor?
Subtract the RMS level from the peak level in dBFS. A signal peaking at 0 dBFS with an RMS of minus 12 dBFS has a crest factor of 12 dB.
What is a good crest factor for a mixed track?
A master bus crest factor of 10–14 dB is generally healthy for most genres, preserving transient punch while leaving room for a mastering limiter to work without crushing dynamics.
Does compression always reduce crest factor?
Yes. Compression raises the average RMS level relative to the peaks, which narrows the gap and reduces crest factor. Fast attack settings have the strongest effect on transient content.
How does crest factor relate to streaming loudness standards?
Platforms using EBU R128 and ITU BS.1770 normalise to a target loudness level. A mix with a higher crest factor and lower RMS will be turned up to meet the target, rewarding producers who preserve dynamics rather than maximise peak loudness.