

A mix analyzer is very accurate at measuring things that have a definition: loudness, true peak, clipping, phase, stereo correlation and band-by-band balance. It is only as useful as the context behind the numbers: your genre, your target and your intent. The measurement tells you what is happening in the file. Deciding whether that is right for this song is a separate job, and that is where the quality of an analyzer really shows.
We built AubioMix around that split. Every report gives objective measurement and subjective guidance side by side, so you know which lines are facts and which are judgement calls. Below, we go through what an analyzer can measure reliably, what makes results drift, and how to test any report against your own ears.
TL;DR
- Loudness, true peak, clipping, phase and stereo correlation are standardised or countable measurements, so a well-built analyzer gets them right.
- Accuracy drops when the tool has to compare your mix with a genre average, because the answer depends on the genre, the mix/master status and your intent.
- Always match levels before you compare anything, or the louder version will win every time.
- Check the report against two or three playback systems and a loudness-matched reference.
- The most useful report pairs measurements with practical steps for your genre. That is what an AubioMix report is designed to do.
Table of Contents
- What "accuracy" means for a mix analyzer
- What an analyzer measures reliably
- Where analyzer results drift
- What the data says producers get wrong most often
- How to test any analyzer report yourself
- Why measurement alone is not the whole answer
- What a more useful report looks like
- Get a report you can act on
- Our perspective
- FAQ
- Sources
What "accuracy" means for a mix analyzer
When producers ask whether an analyzer is accurate, they usually mean two different things.
- Measurement accuracy. Did the tool read the file correctly? Is the integrated loudness really that value, and did it count the clipped samples properly?
- Advice accuracy. Is the suggestion right for this song? Should the low mids really come down, or is that boxiness part of the character?
The first is largely a solved problem, because it rests on published standards and simple counting. The second is a question of interpretation, and it depends on how the tool was built and what it knows about your track.
Keeping the two apart saves you a lot of confusion. A report can be spot-on about a 4 dB crest-factor reading and still not know that you wanted a dense, crushed chorus on purpose.
What an analyzer measures reliably
The researchers who analysed a large dataset of uploaded mixes and masters in a 2024 arXiv study describe the kind of digital signal processing involved, and it shows which readings are on solid ground:
- Loudness and true peak are calculated according to the ITU BS.1770 standard.
- Dynamic range is calculated in dB from the ratio of the maximum to the mean amplitude.
- Mono compatibility is checked through mid/side correlation.
- Tonal profile is built by splitting the spectrum into four bands: 20 to 250 Hz, 250 to 2000 Hz, 2000 to 8000 Hz and 8000 to 20000 Hz.
- Clipping is found by counting samples above 0 dBFS.
- Phase problems are flagged when the mean phase difference passes a set threshold.
These are numbers, not opinions. If two competent tools measure the same file with the same standard, they should land very close together.
Loudness is the best-validated reading
Loudness is the clearest example. The US broadcast document ATSC A/85 says the BS.1770 method was validated in listening tests against perceived loudness of mono, stereo and multichannel material. For delivery in US broadcast, it gives a target of −24 LKFS with a ±2 dB measurement tolerance and true peak kept below −2 dB TP. Those are broadcast figures, not streaming ones, so don't apply them to a music release. They do show how the loudness measure is defined and where a tolerance sits.
Older meters tell a different story. A 2010 NAB technical paper explains that PPM and VU meters correlate poorly with perceived loudness, because they were designed to protect equipment from overload. BS.1770 is frequency-weighted and time-averaged, which is why it tracks what you hear much better. If you want the current music-streaming targets, our streaming loudness targets guide covers them.

Phase, stereo and clipping
Phase and stereo readings are also dependable, and they catch things your ears miss on a good monitoring setup. A mix that collapses in mono is a real risk on phones and smart speakers. If you want to learn how to read the scopes yourself, our phase scope checklist and the stereo imaging guide show what to look for.
Where analyzer results drift
The same arXiv paper notes that outcomes depend on information the user provides, such as the genre and whether the file is a mix or a master. That one sentence explains most complaints about accuracy.
1. Genre baselines
Compression in that study is measured as dynamic range and compared against empirical genre averages. If you pick the wrong genre, or your track sits between two, the verdict on "under-compressed" or "too loud" shifts. A techno kick and a singer-songwriter vocal do not share a benchmark. Measured genre data helps here, which is why we publish mix and mastering benchmarks by genre.
2. Mix versus master
Upload a mix with its bus peaking at −5 dBFS and a loudness-focused tool may tell you it is quiet. That is not an error in the meter. It is a mismatch between the stage you are at and the stage the tool assumed. Leaving headroom on a mix is normal practice before mastering, so tell the tool which stage you are at.
3. Heuristic thresholds
Some flags rest on rule-of-thumb cut-offs: the arXiv study, for instance, treats more than 10,000 clipped samples as major clipping and uses a fixed phase-difference threshold. These are sensible defaults, but they are defaults. A single clipped transient from a drum sample deliberately hit hard is not the same as a clipped bus.
4. Intent
No meter knows that the harsh top end is a stylistic choice, or that the wide, washed-out chorus is the whole point of the record. This is where measurement ends and judgement begins, and it is the reason the report you read should say plainly which statements are objective and which are advice.
What the data says producers get wrong most often
The 2024 study looked at 218,109 entries, made up of 67,838 mixes and 150,217 masters, and found the most common problems were under-compression, limits in the stereo field and excessive loudness. That is useful if you are triaging: if you are unsure where to start, look at dynamics, width and your final level before you spend hours on fine EQ moves.
It also shows that analyzers are good at finding broad, common problems. The finer questions, such as how a kick and bass relate in your specific arrangement, need more than a threshold.
How to test any analyzer report yourself
A good report should survive a few simple checks. Run them whenever you try a new tool, or when a reading surprises you.
Step 1: Match levels before you compare
Loudness bias is the easiest way to fool yourself. The Ghost Production suggests leaving around −6 dB headroom on the mix bus and bringing the reference down until the chorus feels equally loud. Their test is a good one: if a reference only sounds better when it is louder, the comparison has taught you nothing.
The analyzer should do the same. When a report compares your mix with a reference, it needs to compare at matched loudness. Our reference track analysis guide goes through fair comparison in detail.
Step 2: Compare one thing at a time
A five-step method from Waves works through perceived level, dynamics, EQ, panning, then imaging and transients. It also suggests comparing bass first and notes that commercial releases often pull back in the 250 to 500 Hz range. Take each analyzer claim and test it against that one dimension, not against your overall impression.
Step 3: Check translation on real systems
An analyzer measures the file. You still need to hear how it plays out. Lord Reverb recommends checking at 70 to 75 dB SPL on at least three systems before exporting, and reports that a vocal vanishing on a phone speaker points to a 1 to 3 kHz presence problem, while missing bass points to the area below 80 Hz. Treat those as starting points to investigate, not rules.
If you mix on headphones, our headphone mixing guide shows how to make those mixes travel.
One caution from the monitoring world: mastering engineer Bob Katz, in an interview with URM Academy, advises learning one well-treated setup and using secondary speakers only for translation checks, not moving faders in response to them. HARMAN's Circle of Confusion explains why: if you correct for a bass-light system, you add bass that then sounds like too much on a neutral one. An objective analyzer reading is a helpful third reference here, because it doesn't suffer from your room.

Step 4: Test the claim against a track you know
Run a finished record you know well, in your genre, through the tool. If the report calls a professionally released song dull or too narrow, the genre baseline or the settings are off. If it picks out things you can hear on playback, it is earning your trust.
Step 5: Act on one change and re-run
Make the single change the report recommends, bounce, and analyse again. A reliable report shows the reading moving in the expected direction. Progress tracking makes this easier because you can see each version against the last.
Why measurement alone is not the whole answer
The broadcast view is instructive. ATSC A/85 states that loudness is a subjective phenomenon and that human hearing is the best judge. The measurement is there to keep things consistent within and between programmes, not to replace the person making decisions. The same logic holds for mixing: meters confirm and stabilise what your ears decide.
Practice supports this too. A 2014 AES paper by Pestana and Reiss looked at nearly 60 successful engineers, more than 900 UK and US number-one singles, over 20 listening tests and more than 100 interviews. It found support for habits such as a centred low end, mono compatibility and EQ to avoid masking. Those are exactly the areas where an analyzer can give you hard evidence, and where experienced-engineer knowledge tells you what to do about it.
That combination is the point. A reading that says "energy is building up between 200 and 400 Hz" is useful. A recommendation that says which element to move, by roughly how much, in this genre, is what saves you a revision.
What a more useful report looks like
If you are choosing how to evaluate your mixes, here is what to look for, whichever way you go:
| What to look for | Why it matters for accuracy |
|---|---|
| Standards-based loudness and true peak | Readings you can trust and repeat |
| Genre-aware benchmarks | Fewer false alarms on dynamics and loudness |
| Separate objective and subjective points | You can see which lines are facts and which are advice |
| Specific, actionable steps | Turns a reading into a decision |
| Coverage beyond loudness: compression, masking, phase, stereo, effects | Most problems sit outside the loudness meter |
| Progress tracking across versions | Confirms whether a change helped |
Our own write-up on how to analyse a mix walks through reading these results in order, and the benefits of AI mix feedback explains where this kind of feedback fits into a producer's routine.
Get a report you can act on
AubioMix is an online app: you upload an audio file of your song and receive detailed feedback and actionable steps for mixing and mastering across 15+ areas, including compression, EQ, frequency masking, effects, stereo width, phase, loudness, noise and clipping, mastering prep and device translation. You get visual and written reports, a downloadable PDF, progress tracking and leaderboard comparison.
A single mix review costs £4.99, and a reference pass is £2.99. If you work on mixes regularly, the Professional plan is £19.99 per month and Professional + is £34.99 per month, both on the pricing page. Our evaluation framework is regularly updated to reflect current genre standards, and every report gives both subjective guidance and objective measurement.
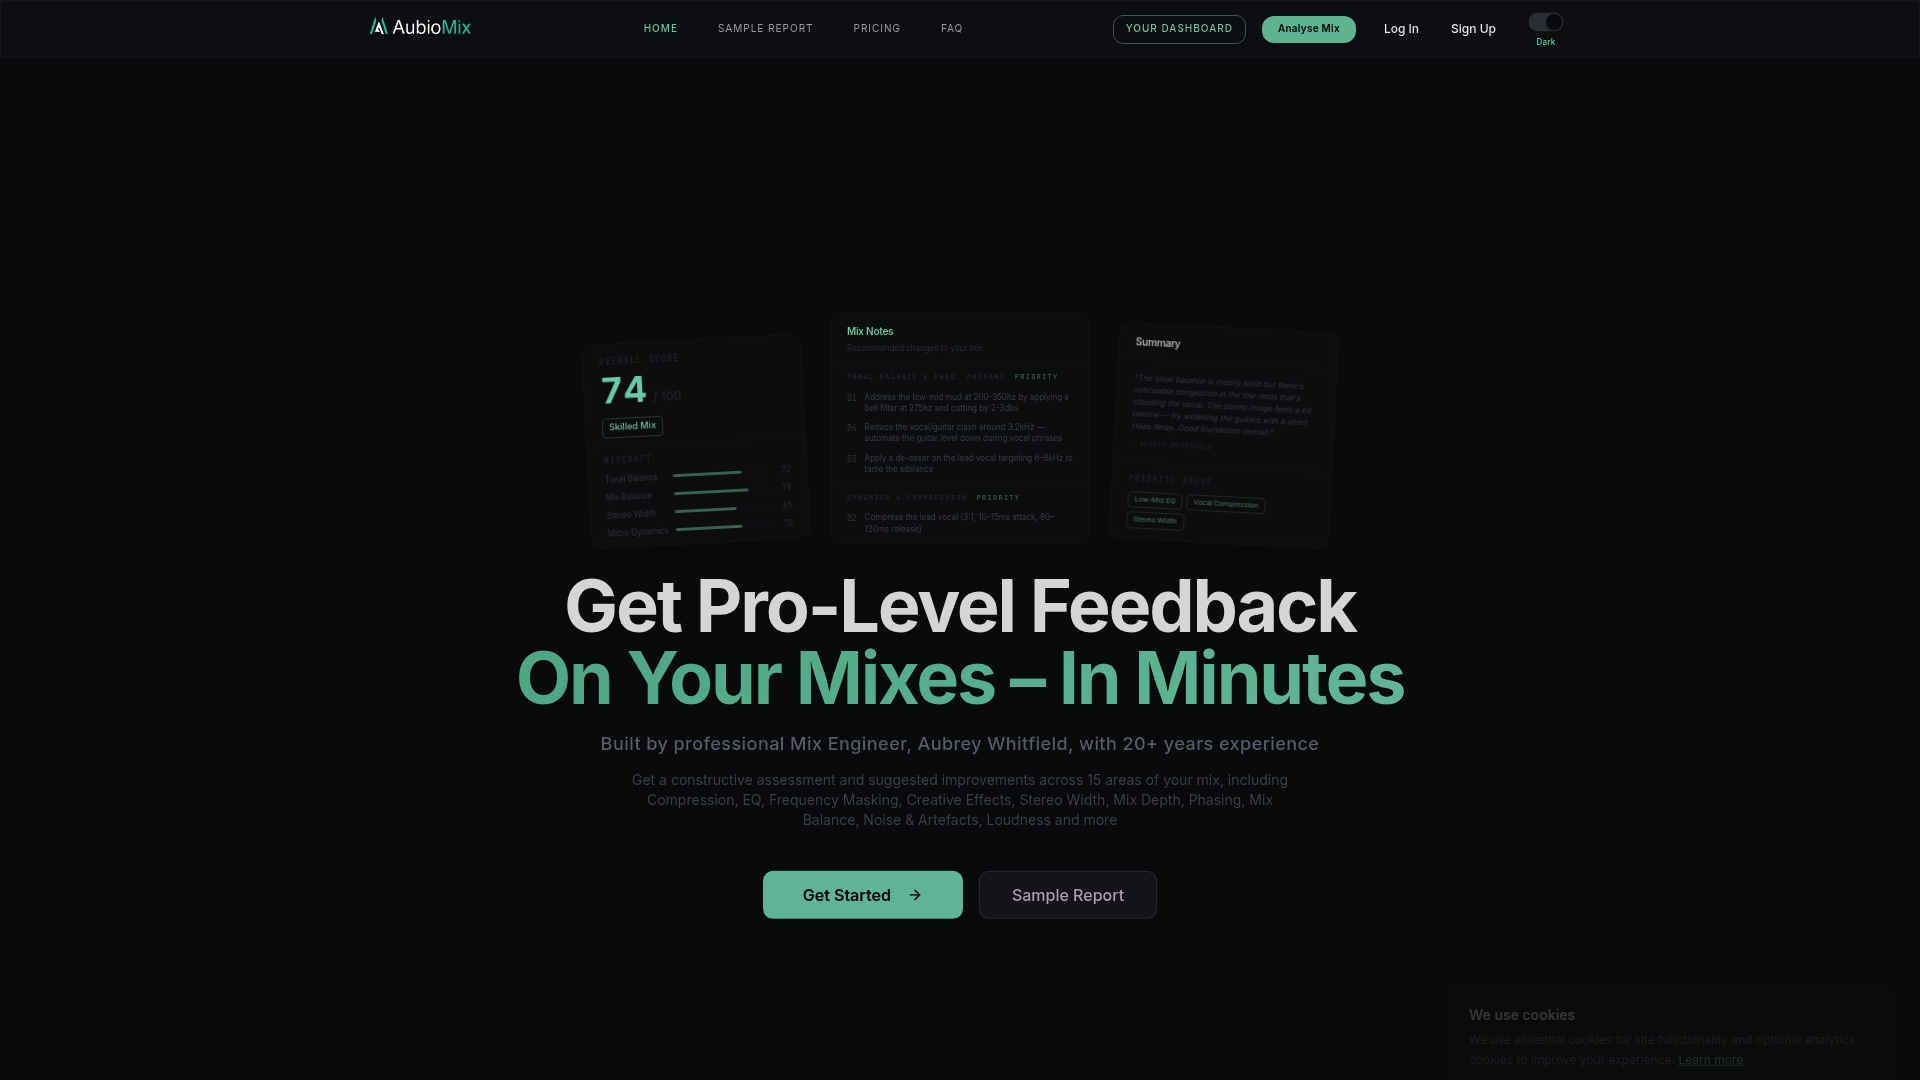
If you want to see how a report reads before committing to a plan, start with one mix review on the version you are about to bounce.
Our perspective
We think the accuracy question is really a question about what you do after the number appears. Every producer can read a loudness meter. The harder part is knowing whether a 200 to 400 Hz build-up is mud, or the warmth that makes the track work.
That is why AubioMix pairs audio intelligence analysis with the practical experience of our founder, a multi-award-winning mix engineer with more than 20 years in the studio. The measurements stay objective. The guidance reflects what a working engineer would say about your genre and where the mix stands.
Our aim is a report that says what to change, why it matters and what to listen for afterwards, so each revision is quicker than the last. We built the reports to be checked against your ears, your reference tracks and your other playback systems, and to give you something concrete to check.
AubioMix
FAQ
Are online mix analyzers accurate?
For measurable properties such as loudness, true peak, clipping, mid/side correlation and spectral balance, a well-built tool is accurate because those readings follow defined standards or simple counts. Advice on what to change depends on the genre and mix stage you give it, so set those carefully. Treat each recommendation as a prompt to listen, then decide.
How do I check if my mix is good?
Match the level of a professional reference in your genre, then compare loudness, width, tonal balance and element balance one at a time. Play the mix on at least three systems, such as monitors, headphones and a phone. An analyzer report adds objective readings on top of that, so you are not relying on your ears alone.
Can an analyzer tell me if my mix is ready for mastering?
It can check the objective prerequisites: headroom, clipping, mono compatibility and noise. Mix-bus peaks in the region of −6 to −3 dBFS are commonly suggested to leave a mastering engineer room. Whether the balance and tone are right for the song is a judgement, and an AubioMix report gives you both the measurements and written guidance on it.
Why does my analyzer say my mix is too quiet or too loud?
Usually the tool is comparing against a genre or release target that does not match your stage. A mix with headroom left for mastering will read quieter than a finished master. Check that the file is labelled correctly and that the genre fits the track.
Sources
- Exploring trends in audio mixes and masters (arXiv, 2024)
- ATSC A/85, Techniques for Maintaining Audio Loudness
- NAB technical paper on loudness measurement (2010)
- Pestana and Reiss, AES paper (2014)
- The Ghost Production, reference tracks
- Waves, the 5-step mix referencing method
- Lord Reverb, why a mix sounds different everywhere
- URM Academy, interview with Bob Katz
- HARMAN, the Circle of Confusion